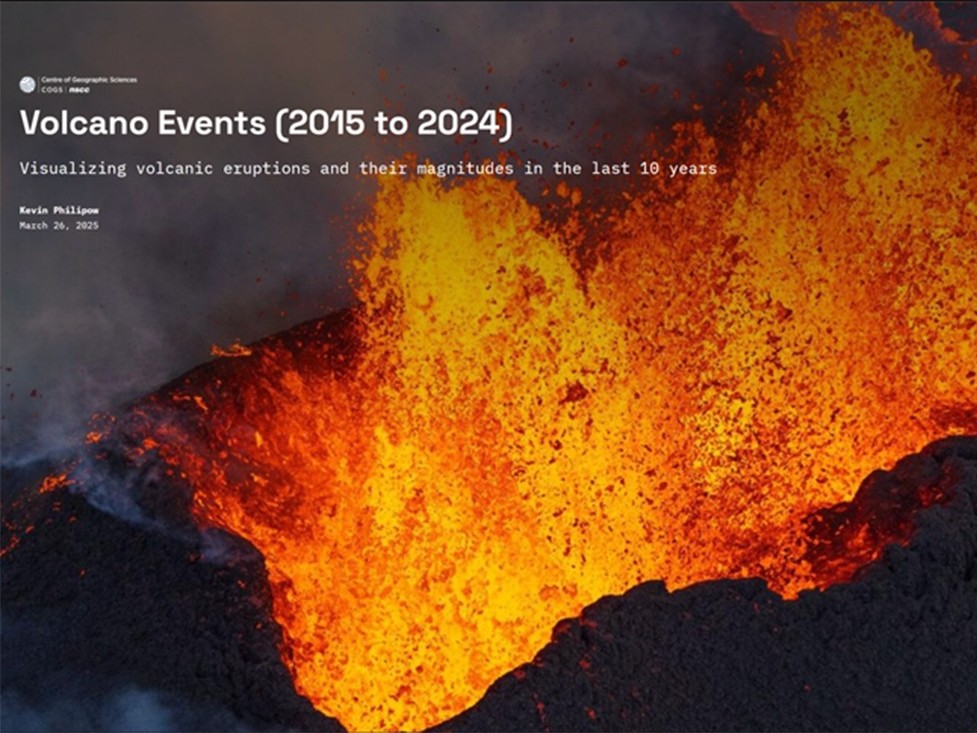
ArcGIS Dashboard and StoryMap
Project Information
Understanding the risks associated with volcanic hazards is crucial, as volcanic eruptions can significantly impact local communities, agriculture, infrastructure, and the environment (U.S. Geological Survey [USGS], 2025). My story map aims to bring clarity to the complex nature of volcanic eruptions through the power of geographic data and dynamic visualizations. It examines eruption locations, magnitudes, and frequencies to gain a deeper understanding of the spatial and temporal patterns, behaviors, and impacts of volcanoes.
The first step in creating this story map was to find open-source data, then prepare and use it to develop a customized AGOL Web Map. Once the map was styled and configured as desired, it was referenced in an ArcGIS Dashboard with various data visualizations and interactive elements to allow users to identify trends and patterns. The dashboard also needed to be styled and configured before embedding it into a cohesively designed ArcGIS StoryMap with additional elements such as pictures, videos, and an insightful narrative. This 3-step process is not only both fun and rewarding for the developer, but also provides an engaging experience for the end user.

