Statistical Mapping
Project Information
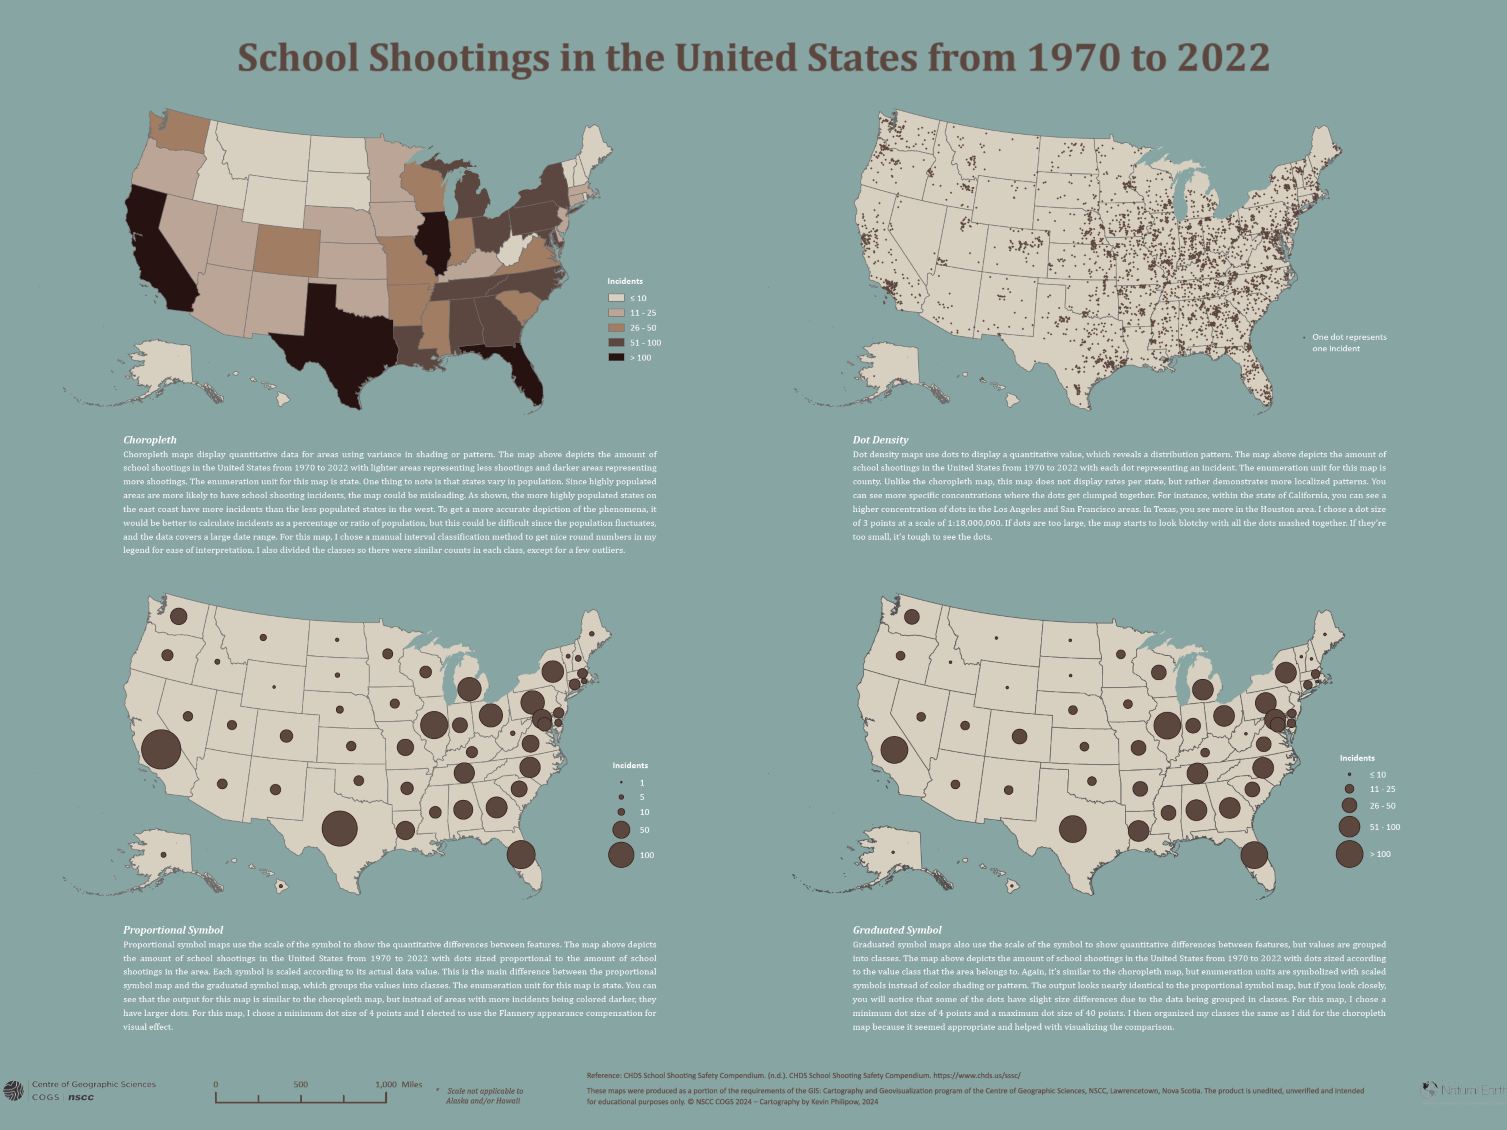
The goal of this poster was to explore and apply different statistical mapping techniques, specifically choropleth, dot density, proportional symbol, and graduated symbol maps. I began by assembling and processing the necessary geographic and statistical data in ArcGIS Pro. I used the same study area across all maps, so I designed a reusable basemap to maintain visual consistency. Each thematic map was carefully styled with appropriate symbology, and I created individual map layouts before exporting them to Adobe Illustrator as AIX files. In Illustrator, I cleaned up the exported layers and brought all maps into a CMYK-formatted poster layout sized to A1. I then added titles, legends, and other cartographic elements, making design adjustments to ensure everything was clear and visually balanced. Each map was accompanied by a short descriptive paragraph explaining the mapping method, my design choices, and any challenges I encountered. The final poster brought together both GIS and design tools to produce a polished presentation of multiple statistical mapping techniques.

