
Taxonomy Chart
Project Information
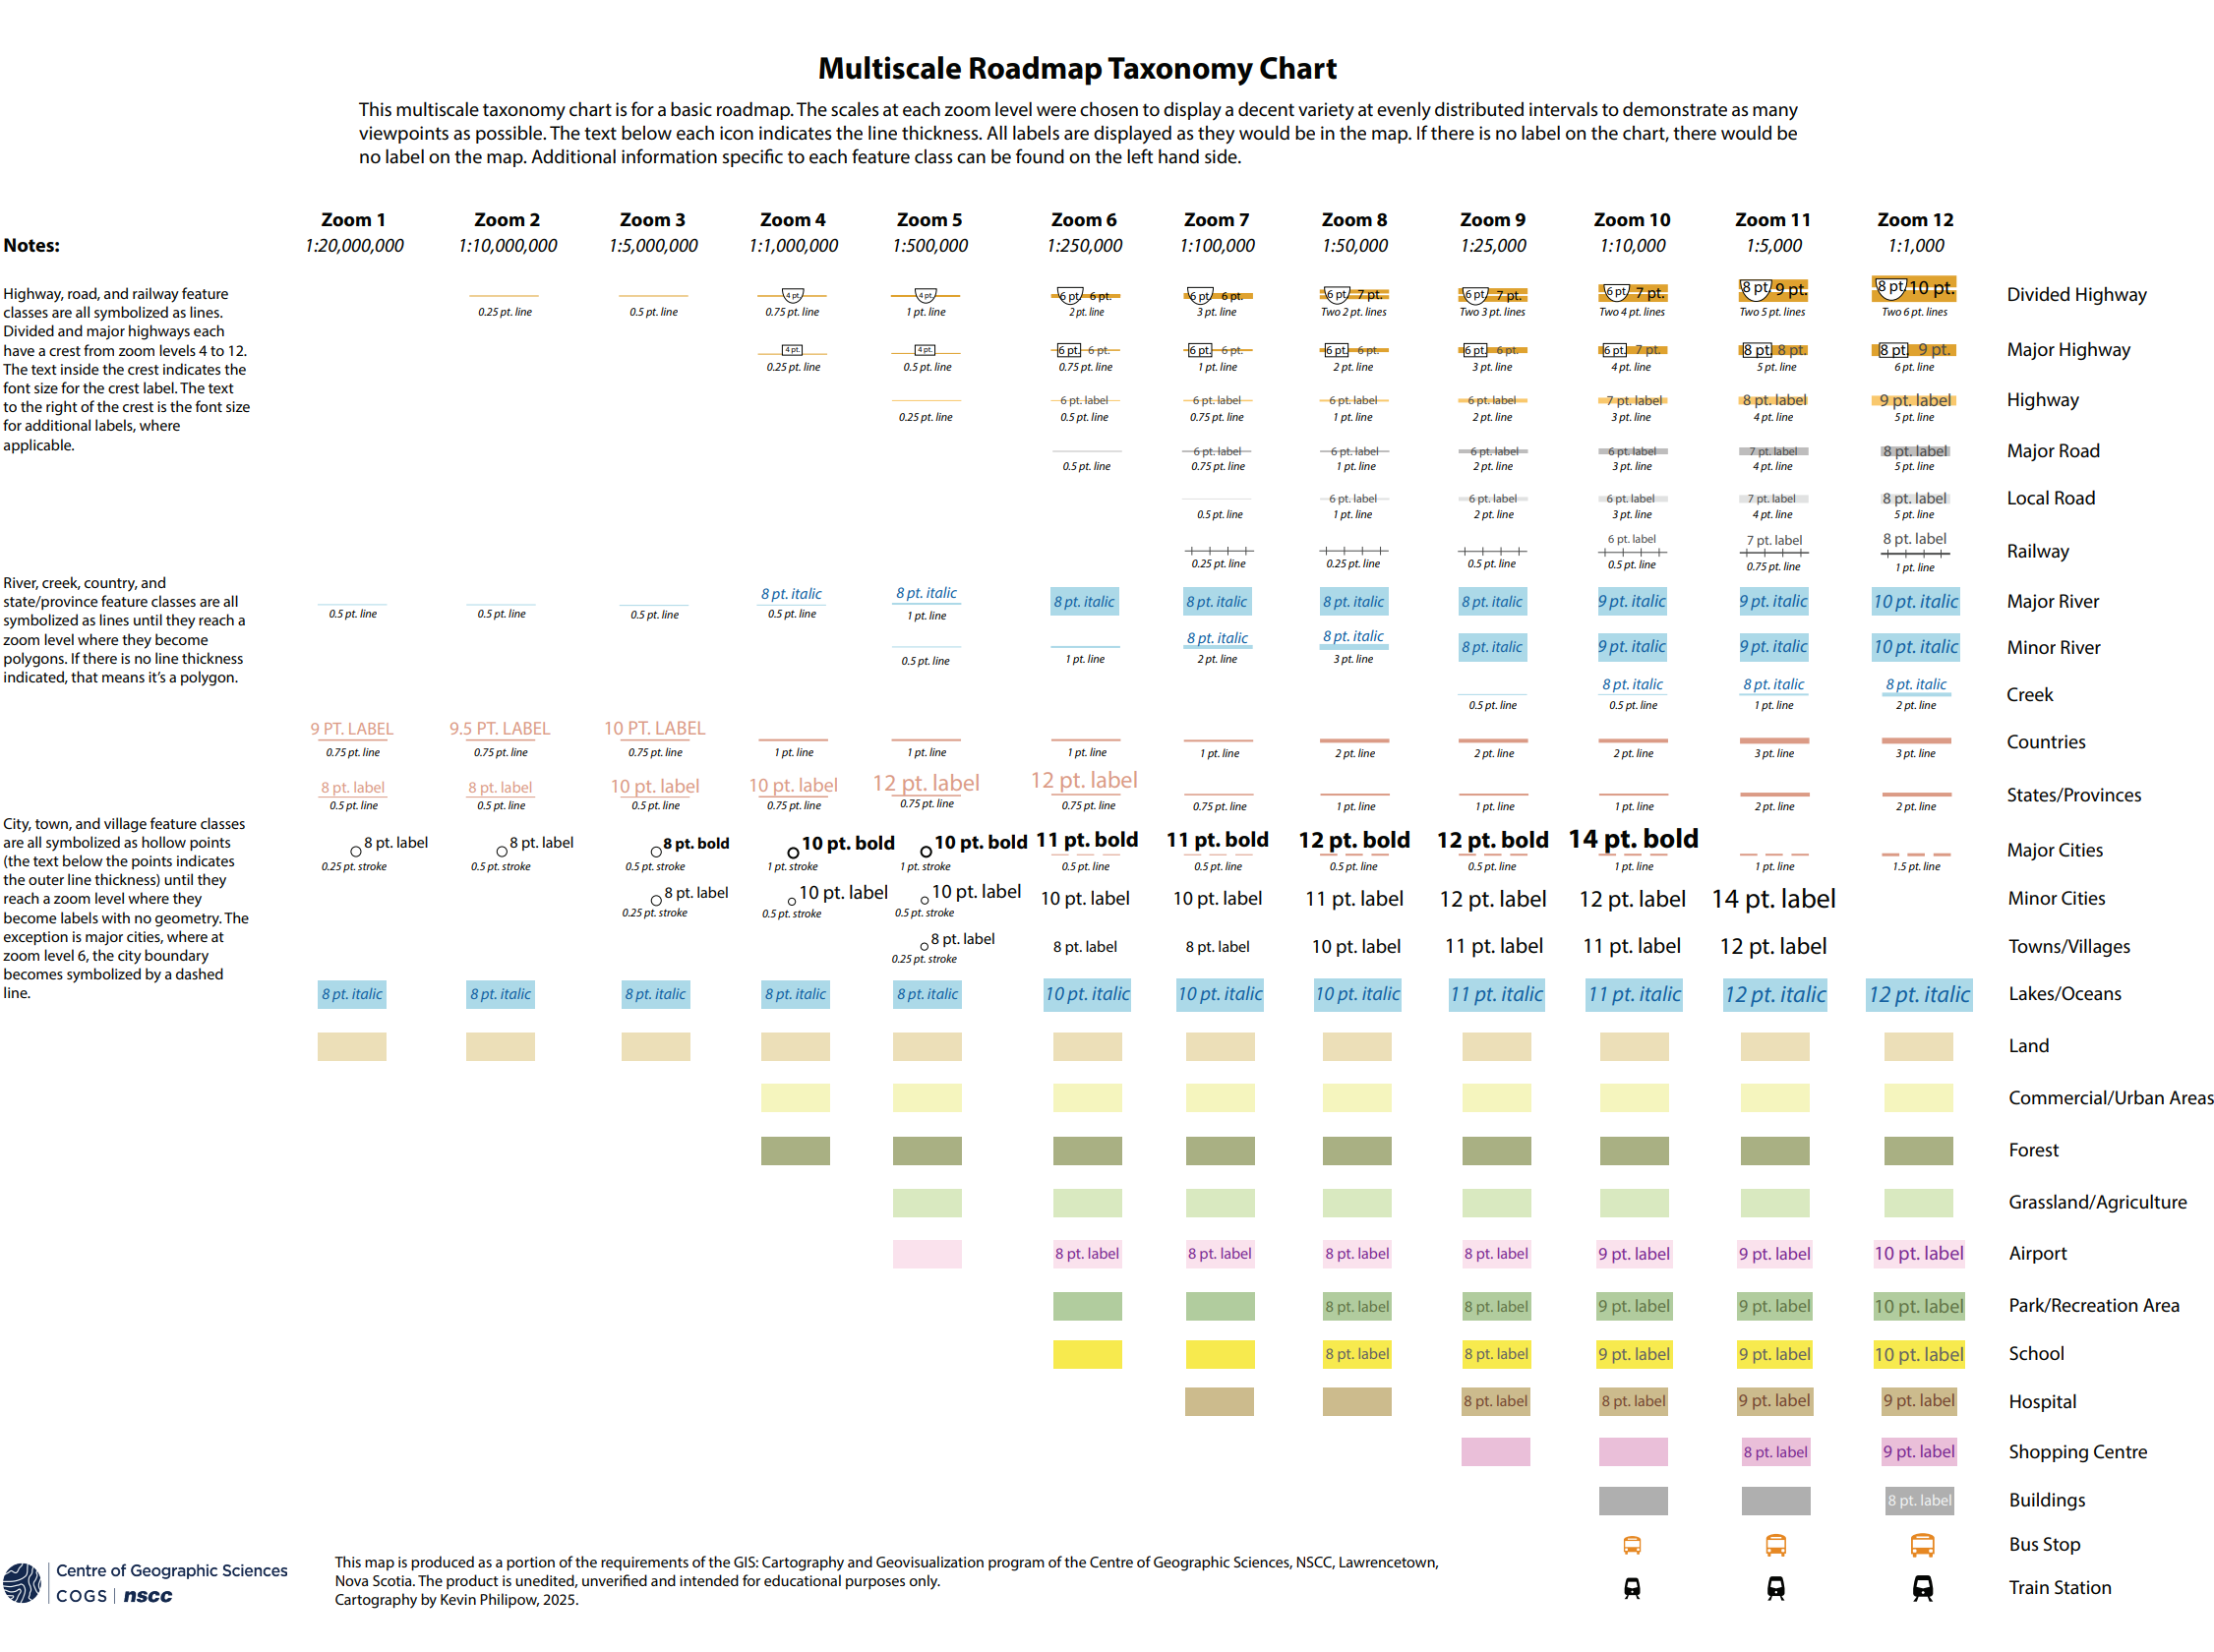
The objective of this assignment was to create a taxonomy chart for a multi-scale vector basemap. It was an effective way of applying knowledge from previous map design classes. It was a bit of a puzzle to create, having to consider several visual variables such as colour, symbolization, levels of measurement, and typography for multiple scales and feature classes. Another challenge was constructing a balanced layout, incorporating all features into one comprehensive page. This task also required a bit of research to determine what might work well at different scale levels. The project was created entirely in Adobe Illustrator.