
H3 in QGIS
Project Information
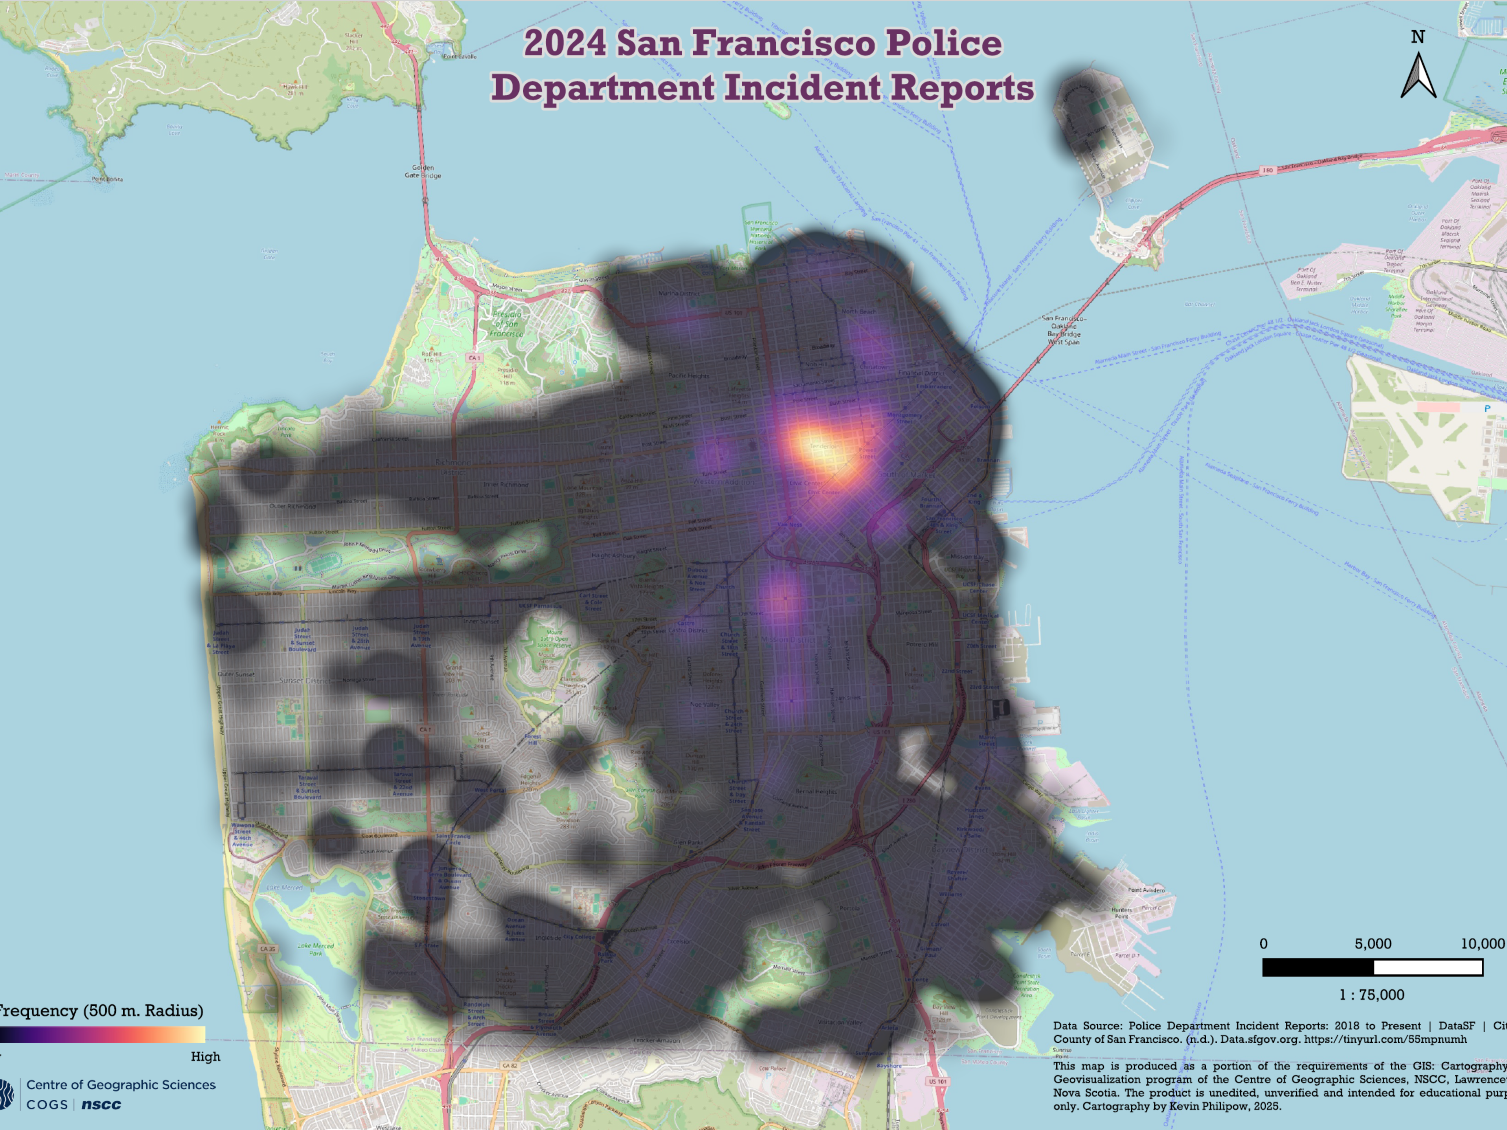
The H3 in QGIS project was named as such because it involved the creation of 3 different maps using the same dataset and the same software, QGIS. I was given a very large dataset and used Microsoft Excel to clean and prepare the data, applying data reduction strategies to limit errors and capacity requirements. Once the data was formatted and ready for use, it was imported into QGIS and advanced visualization and trend analysis techniques were employed, namely a heatmap, a hotspot map, and a hexbin map. The aim was to identify patterns, trends, and phenomena, then put the results into a meaningful, balanced layout. This required the use of appropriate symbology and design principles to clearly and effectively convey the results.