
Infographics Poster
Project Information
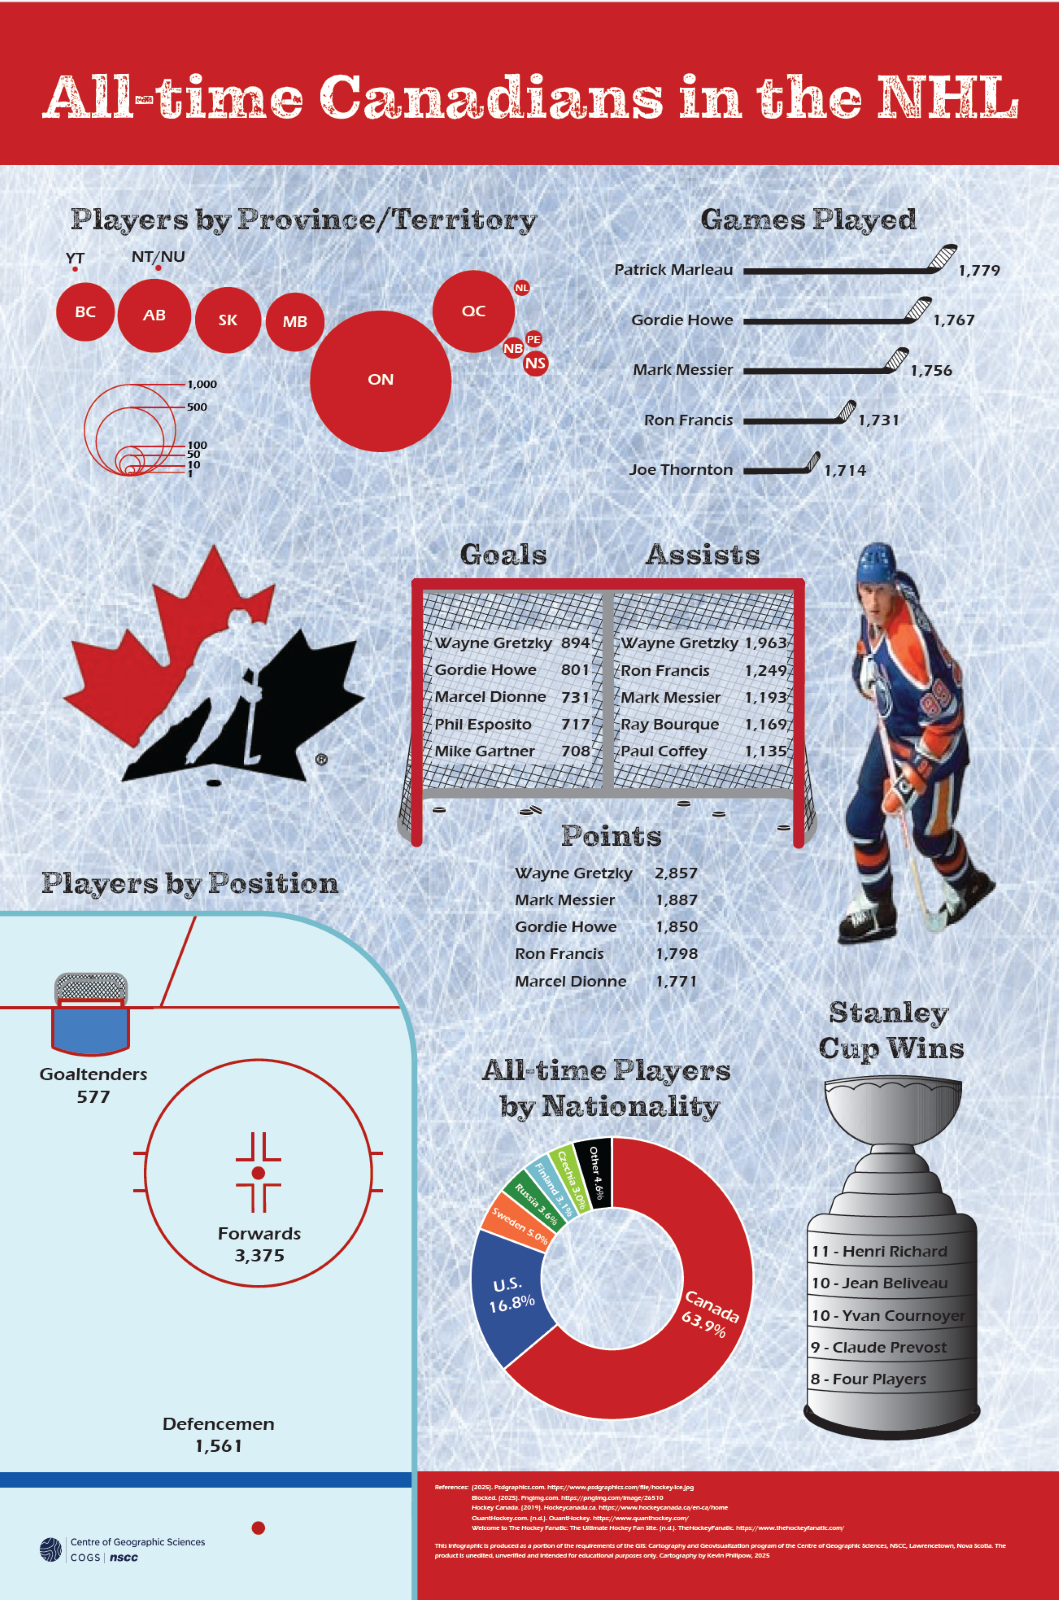
This statistical thematic mapping project involved several elements, which were all put together into an infographic style poster in Adobe Illustrator. The goal was to style each element in a creative graphic manner consistent with the overall theme of the poster and arrange them in a well-balanced, purposeful layout. The poster needed to include a cartogram, a non-statistical graphic, and at least four additional statistical graphic elements such as graphs, charts, word clouds, or pictograms. Other design considerations included a limit of three font type families, CMYK format, proper source citations, and a press-ready Illustrator file with bleed and printer marks. The cartogram was created in ArcGIS Pro and Microsoft Excel was used for the sunburst chart.